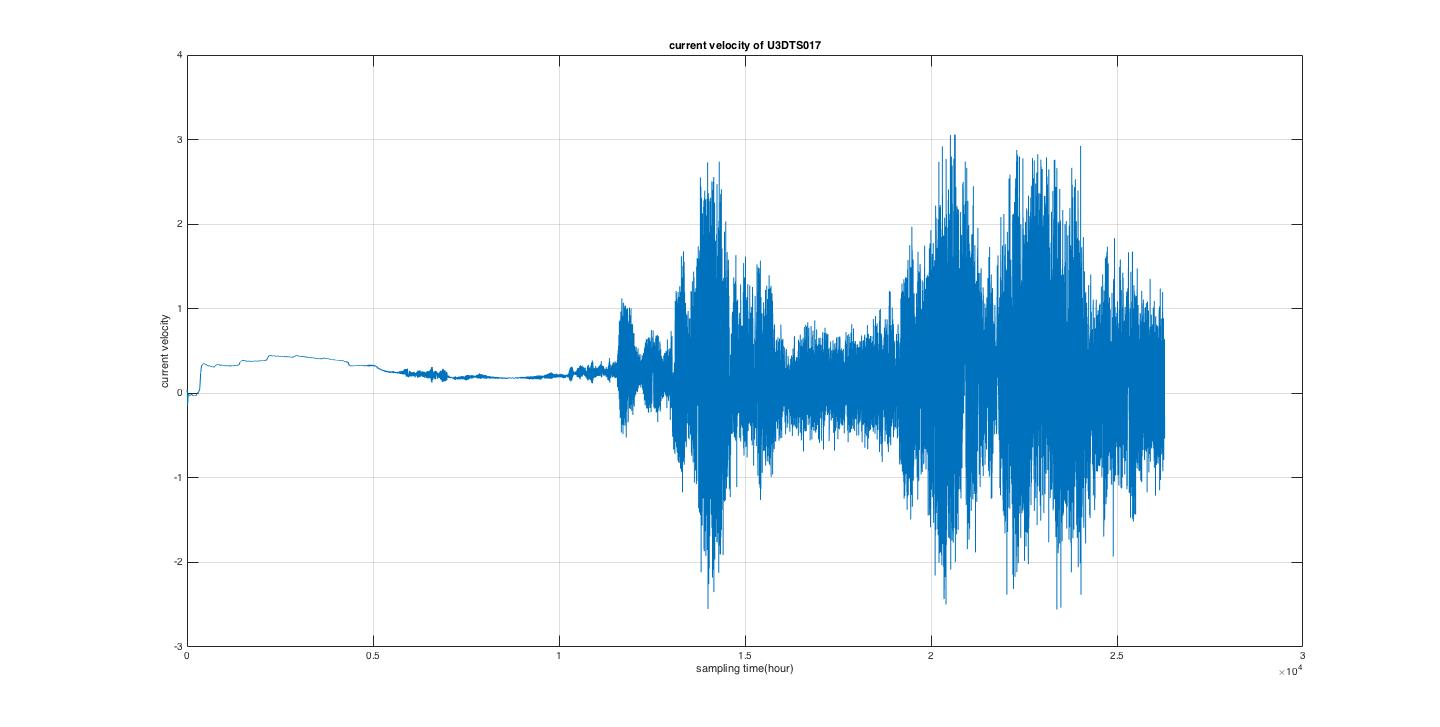
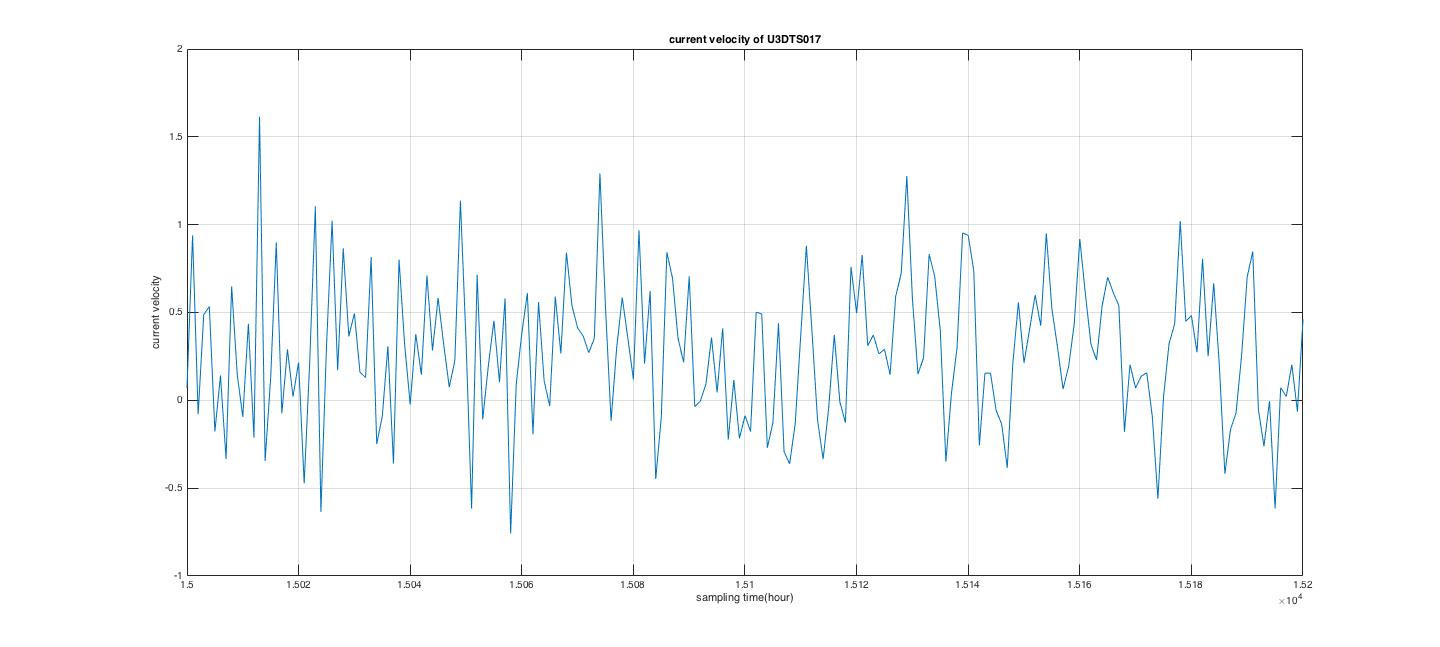
I have posted this problem last 7 days and I am very glad that someone respond to me .But I am afraid that I haven’t described the problem implicitly clearly.So I arrange the post again. In my output files there are two kinds of files concerning the current velocity,that is ‘U3DTSx.OUT’ and ‘V3DTSx.OUT’(the suffix ‘x’ means the location,such as ‘U3DTS001.OUT’).My intuitive thought is ‘U3DTSx.OUT’ indicates the x-component and ‘V3DTSx.OUT’ indicates the y-component of the magnitude velocity.And the + and - of the value in the files represent directions. I have divided my grid into 5 layers vertically.The following 2 points are where I am confused: 1.The file ‘U3DTSx.OUT’ have columns of 7 including the first time column,while the file ‘V3DTSx.OUT’ possesses only 6 columns with an time column.Actually as what I mentioned above,I divided my grid into 5 layers.So why these two files have different number of columns? 2.In my efdc master input file ‘efdc.inp’ I configure it with sampling time of 1 hour.It is well known that the current velocity cannot change direction frequently within a short time period.However,when I plot every columns in Matlab,I find that in the latter fraction of the plotted curve the shape of the curve shows like sawtooth wave with average value of approximate 0 which I think means the current velocity change directions every sampling times from now on.And I have attempted to plot other locations of the reservoir about ‘U3DTSx.OUT’ and the plotted curve behaves the similarly.That makes me crazy!The plotted curves has been attached in the mail.The first picture plots all the scope of sampling time.The second picture narrow the scope to 15000~15200 sampling times. Attached files 

Which version of EFDC are you using? These don’t seem to be standard output formats from EFDC_GVC or from EFDC_DSI/EFDCPlus. They may be legacy output formats from a version of EPA’s EFDC but are no longer supported.