Hi,
Is there a way to obtain summary information about the total horizontal and vertical turbulent diffusivities? I’m also interested in time-series data for these quantities. The Show Run Time Output Summary option in EE seems to give some of the information I’m after, but it’s unclear whether the summaries given in this dialog refer to computational times for each model effect/component, or are actual model summary results for each. Also, is their information about the meanings of these model effects/parameters? The user’s manual gives only a very brief overview of the Show Run Time Output dialog, but does not discuss what the values this dialog summarizes represent.
Thanks for your time.
David
Hi David,
In EFDC_Explorer, the user can output the internal variables by setting ISINWV = 2 in Card C12A in EFDC.inp. When that option is enabled, user can view the internal variables such AH and AV which represent the horizontal and vertical viscosities. You can check the subroutine EE_linkage on efdcout.f90 FORTRAN file. Here you can specify any EE Arrays that you are interested to visualize.
The run times provided in the “Show Run Time Output Summary” in EE reports the time spent by model on each processes. A typical summary looks like following:
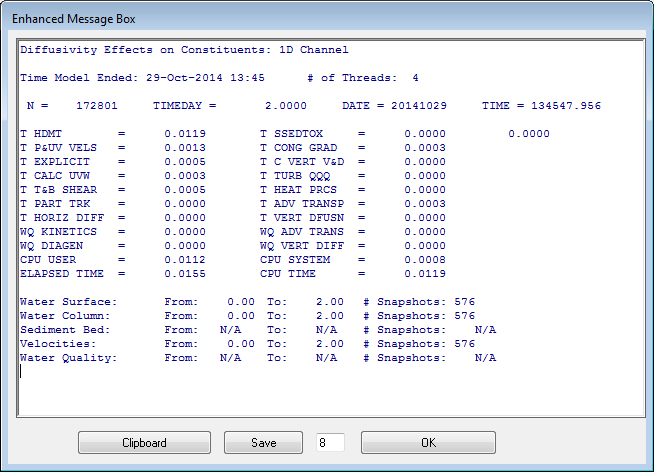
T HDMT represents the time spent on full hydrodynamic and mass transport process
T P&UV VELS represents the time spent on solving external model equations for P, UHDYE, and VHDXE
T EXPLICIT is the time spent on calculating explicit momentum equation terms
T CALC UVW is time spent to solve internal shear mode equations for U, UHDY, V, VHDX and W
T T&B SHEAR is time spent to calculate time variable surface wind stress and load into internal mode forcing
T PART TRK is the time spent in the particle tracking submodel
T HORIZ dIFF is the time spent to calculate horizontal viscosity and momentum diffusion fluxes.
WQ KINETICS is time spent to calculate kinetic sources and sinks
WQ DIAGEN is time spent on sediment diagenesis
T SSEDTOX is time spent on settling and water column bed exchange of sediment and sorbed toxic contaminants
T CONG GRAD is the time spent to solve external mode by a conjugate gradient scheme
T C VERT V&D is time spent to calculate vertical viscosity and diffusivity
T TURB QQQ is time spent on turbulent intensity squared
T HEAT PRCS is time spent on calculation of surface and internal heat source-sink
T ADV TRANSP is time spent on advective transport calculation
T VERT DFUSN is time spent on vertical diffusion
WQ ADV TRANS is time spent on calculation of advection of dissolved and suspended water quality constituents.
WQ VERT DIFF is time spent on vertical diffusion of water quality parameters
Hope it helps.
Best,
Janesh Devkota
Hi Janesh,
Thank you for the prompt reply. I’m not certain how to modify the Fortran code to allow export of these parameters. Will I need a Fortran compiler? Also, will these parameters then be available within the EE 2D plan-view for querying and extracting? Ultimately, I would like to retreive the time-series of average Hz and Vz for the entire model domain for each time-step. The goal is to see how these quantities vary with windspeed, direction, and flow.
How do I proceed with this?
Thanks,
David
Hi David,
If you want to export the internal variables such as “AH” and “AV” you don’t need to recompile to code. You change the variable ISINWV = 2 in card 12A in efdc.inp file. To view the internal variables go to Viewing Options >> Internal variables. The internal variables are stored in EE_ARRAYS.OUT.
After the internal arrays are loaded then you can load “AH” or “AV” from the dropdown menu. Now, to get the time series of average “AH” or “AV” you can choose “General Statistics” button on the top of “View Plan” form. It will ask if you want to choose a polygon to select the cells to be used for statistics ? Choose no and then it will take all the output and will give you the average time series of AH for all the cells for the time period you specify. You can repeat the same process for “AH” or “AV” or any other variables.
If you are interested in any other variables then you can always compile the code. To compile the code, you will need FORTRAN compiler.
I hope this helps.
Best,
Janesh
Thank you Janesh. However, for future reference for others who are also looking to output these parameters, the ISINWV variable should be set to 2.
Hi Janesh,
I have an additional question about the output given in the InternalVars option in the 2D plan-view. The parameter ABO is discussed as being the molecular diffusivity in the efdc.inp file, but appears to be time-variable. Is this correct, or does ABO represent something else, and if so what? Also, is it possible to get time-series of surface shear stresses? I know that bed shears are available.
Thanks,
David
Oh, sorry, one final question. I would like to be able to show the distribution of these parameters in the 2D plan view using color-ramping. However, cells which feature very high values of these parameters usually only a few cells), when viewing the entire domain, cause the color ramping scheme to diminish or shade-out lower values. Is it possible to set an upper limit for what is displayed so that it is possible to see the spatial distribution of these parameters for all or most cells?
Thanks again.
David
Hi David,
ABO defined in EFDC is background molecular diffusivitiy and it is constant during the whole simulation. Internal array AB(L,K) , however, is not constant. Similarly, AHO is constant horizontal momentum and mass diffusivity m2/s and AH(L,K) is a time and spatially varying term.
Yes, it is possible to set an upper limit for what is displayed in the view plan. To achieve that please follow these steps:
1. Click on Display Options on the top menu in “ViewPlan: 2D XY Viewer & graphical Editor” or simply right click on the legend.
2. Then under general options, look for Auto Ramp check button and Min: and Max: as shown in figure below.
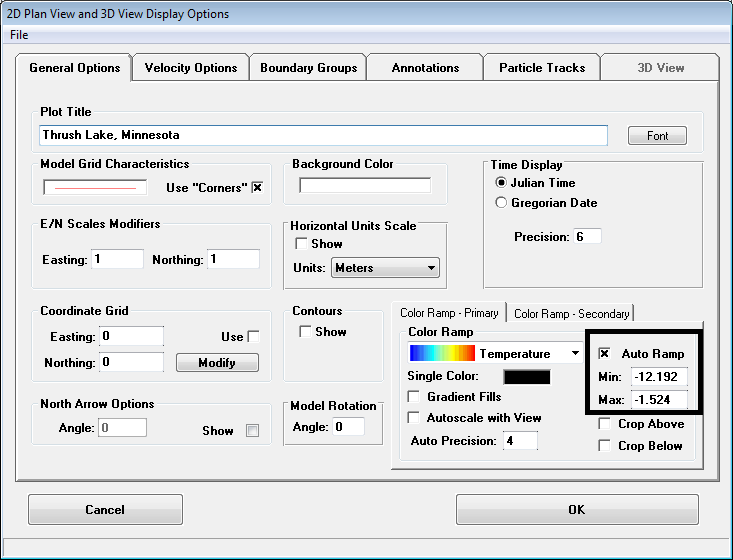
Depending on what version of EE you are using, the layout might slighly differ.
3. Uncheck the auto Ramp button and specify the maximum and minimum values you want to display.
Best,
Janesh Devkota