1、I want to set up a gate in the hydraulic construction module. The gate is controlled by time opening. I have tried to set it up many times without success. Can you provide relevant tutorials on gate setting?
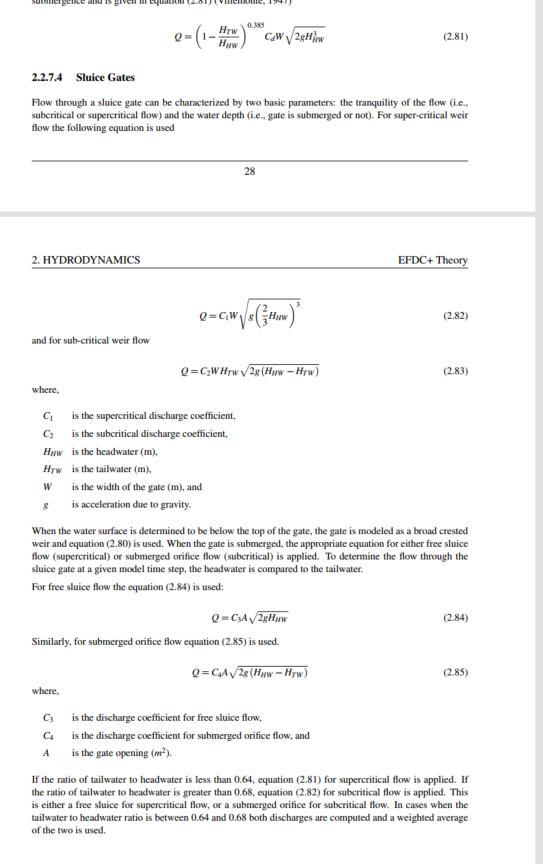
2、I don’t understand what the sentence in the picture means“If the ratio of tailwater to headwater is less than 0.64, equation (2.81) for supercritical flow is applied. If the ratio of tailwater to headwater is greater than 0.68, equation (2.82) for subcritical flow is applied. ” supercritical flow and sub-critical weir flow equation should not be the equation (2.81) and equation (2.82)?Are the equations number written wrong?
3、And how to determine the parameters in equations (2.82-2.85)?If I have traffic data, do I need to set all four parameters?
I sincerely hope that there are tutorials on relevant settings. Thank you.
Thank you very much for your questions and your effort to build Sluice Gates.
Please follow the guidelines below:
- Click on the following video link to understand how to set up a Sluice gate based on time series.

- If you are using EE 11.7 / 11.8… I would like to show you some maps below. Please follow the steps outlined.
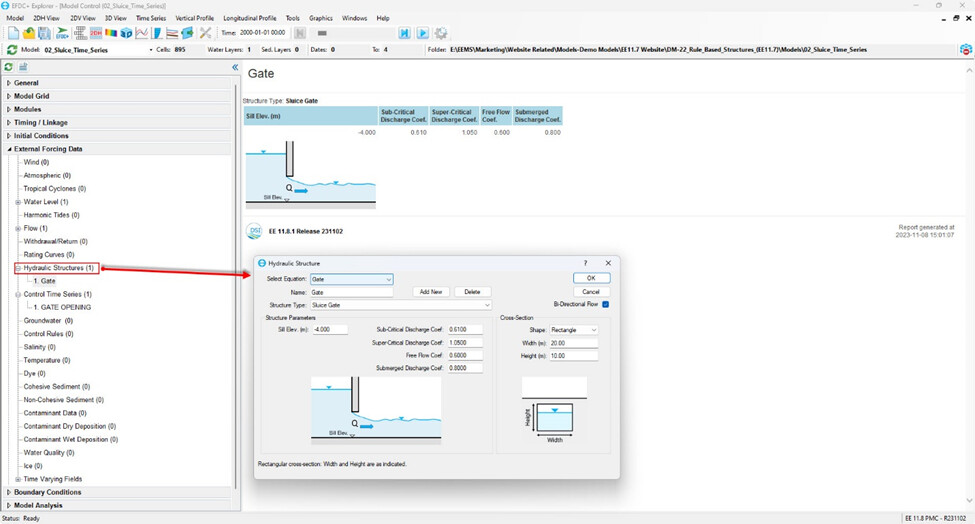
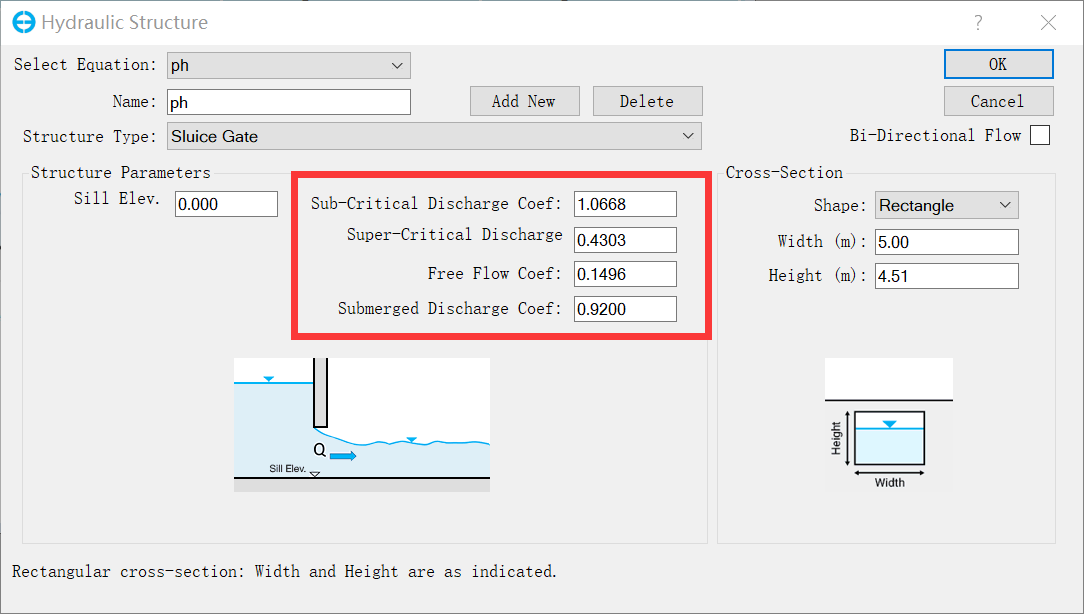
Figure 1: RMC on Hydraulic Structures and set up as displayed (this step is for configuring hydraulic parameters)
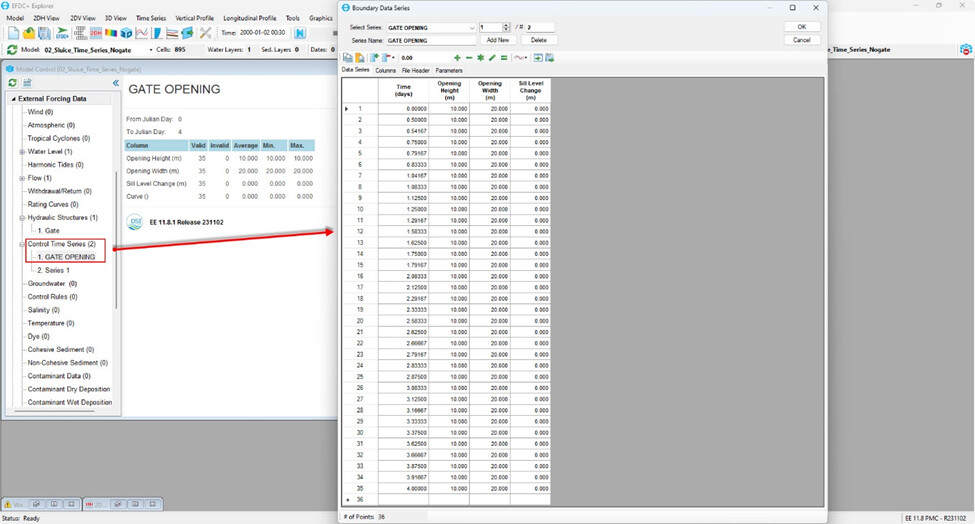
Figure 2: RMC on Control Time Series as displayed (this step is for setting up the Boundary Data series for the sluice gate).
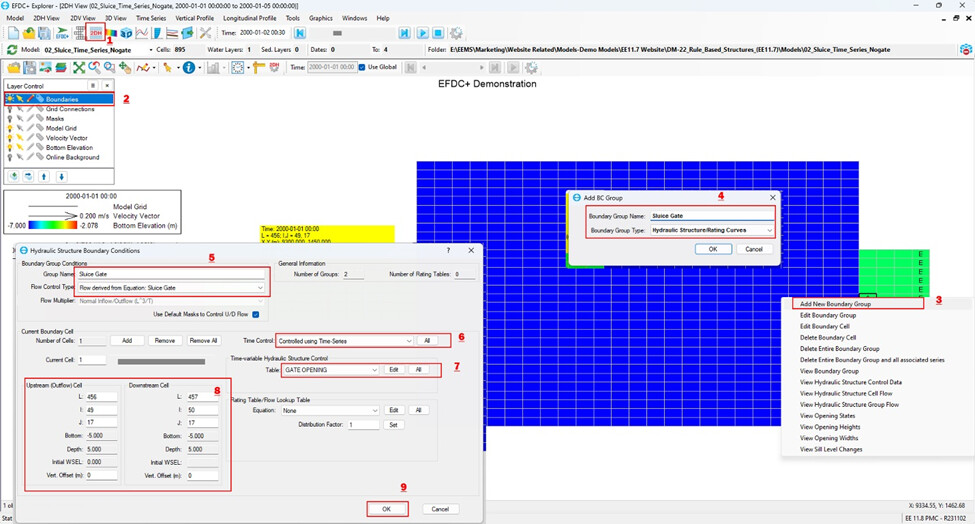
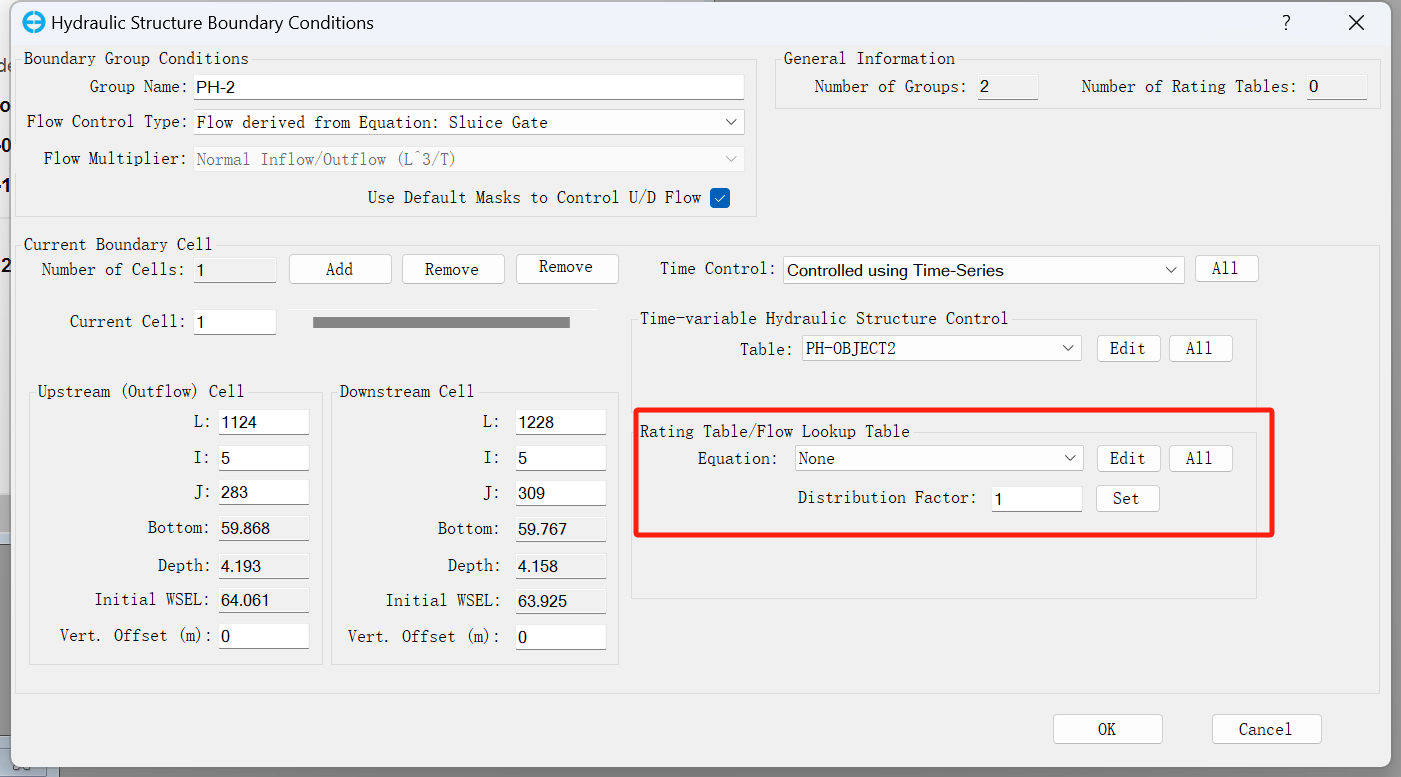
Figure 3: This figure illustrates how to add a sluice gate to your model grid. Please follow the steps from 1 to 9 for easy comprehension.
Regarding your question (I have tried to set it up many times without success), I’m not sure about your specific intention. Are you looking to set up a sluice gate for testing purposes or some other use? If it’s for testing, the guidelines provided above should be helpful.
I hope this guide proves to be useful for you. Please don’t hesitate to reach out if you require any further assistance. Thank you very much
The Data series
| Time (days) | Openning Height | Openning Width | Sill Level Change |
|---|---|---|---|
| 0 | 10 | 20 | 0 |
| 0.5 | 10 | 20 | 0 |
| 0.54167 | 10 | 20 | 0 |
| 0.75 | 10 | 20 | 0 |
| 0.79167 | 10 | 20 | 0 |
| 0.83333 | 10 | 20 | 0 |
| 1.04167 | 10 | 20 | 0 |
| 1.08333 | 10 | 20 | 0 |
| 1.125 | 10 | 20 | 0 |
| 1.25 | 10 | 20 | 0 |
| 1.29167 | 10 | 20 | 0 |
| 1.58333 | 10 | 20 | 0 |
| 1.625 | 10 | 20 | 0 |
| 1.75 | 10 | 20 | 0 |
| 1.79167 | 10 | 20 | 0 |
| 2.08333 | 10 | 20 | 0 |
| 2.125 | 10 | 20 | 0 |
| 2.29167 | 10 | 20 | 0 |
| 2.33333 | 10 | 20 | 0 |
| 2.58333 | 10 | 20 | 0 |
| 2.625 | 10 | 20 | 0 |
| 2.66667 | 10 | 20 | 0 |
| 2.79167 | 10 | 20 | 0 |
| 2.83333 | 10 | 20 | 0 |
| 2.875 | 10 | 20 | 0 |
| 3.08333 | 10 | 20 | 0 |
| 3.125 | 10 | 20 | 0 |
| 3.16667 | 10 | 20 | 0 |
| 3.33333 | 10 | 20 | 0 |
| 3.375 | 10 | 20 | 0 |
| 3.625 | 10 | 20 | 0 |
| 3.66667 | 10 | 20 | 0 |
| 3.875 | 10 | 20 | 0 |
| 3.91667 | 10 | 20 | 0 |
| 4 | 10 | 20 | 0 |
Thank you for your reply,About the question (I have tried to set it up many times without success) I means when I have the gate’s openning width and sill elev and flow and wate level datas, how could I determine the Sub -critical Discharge Coef Super-Critical Discharge Free Flow Coef and Submerged Discharge Coef ? About these four arameters I have tried to set it up many times,but not success ,so I really need your help ,Thank you very much!
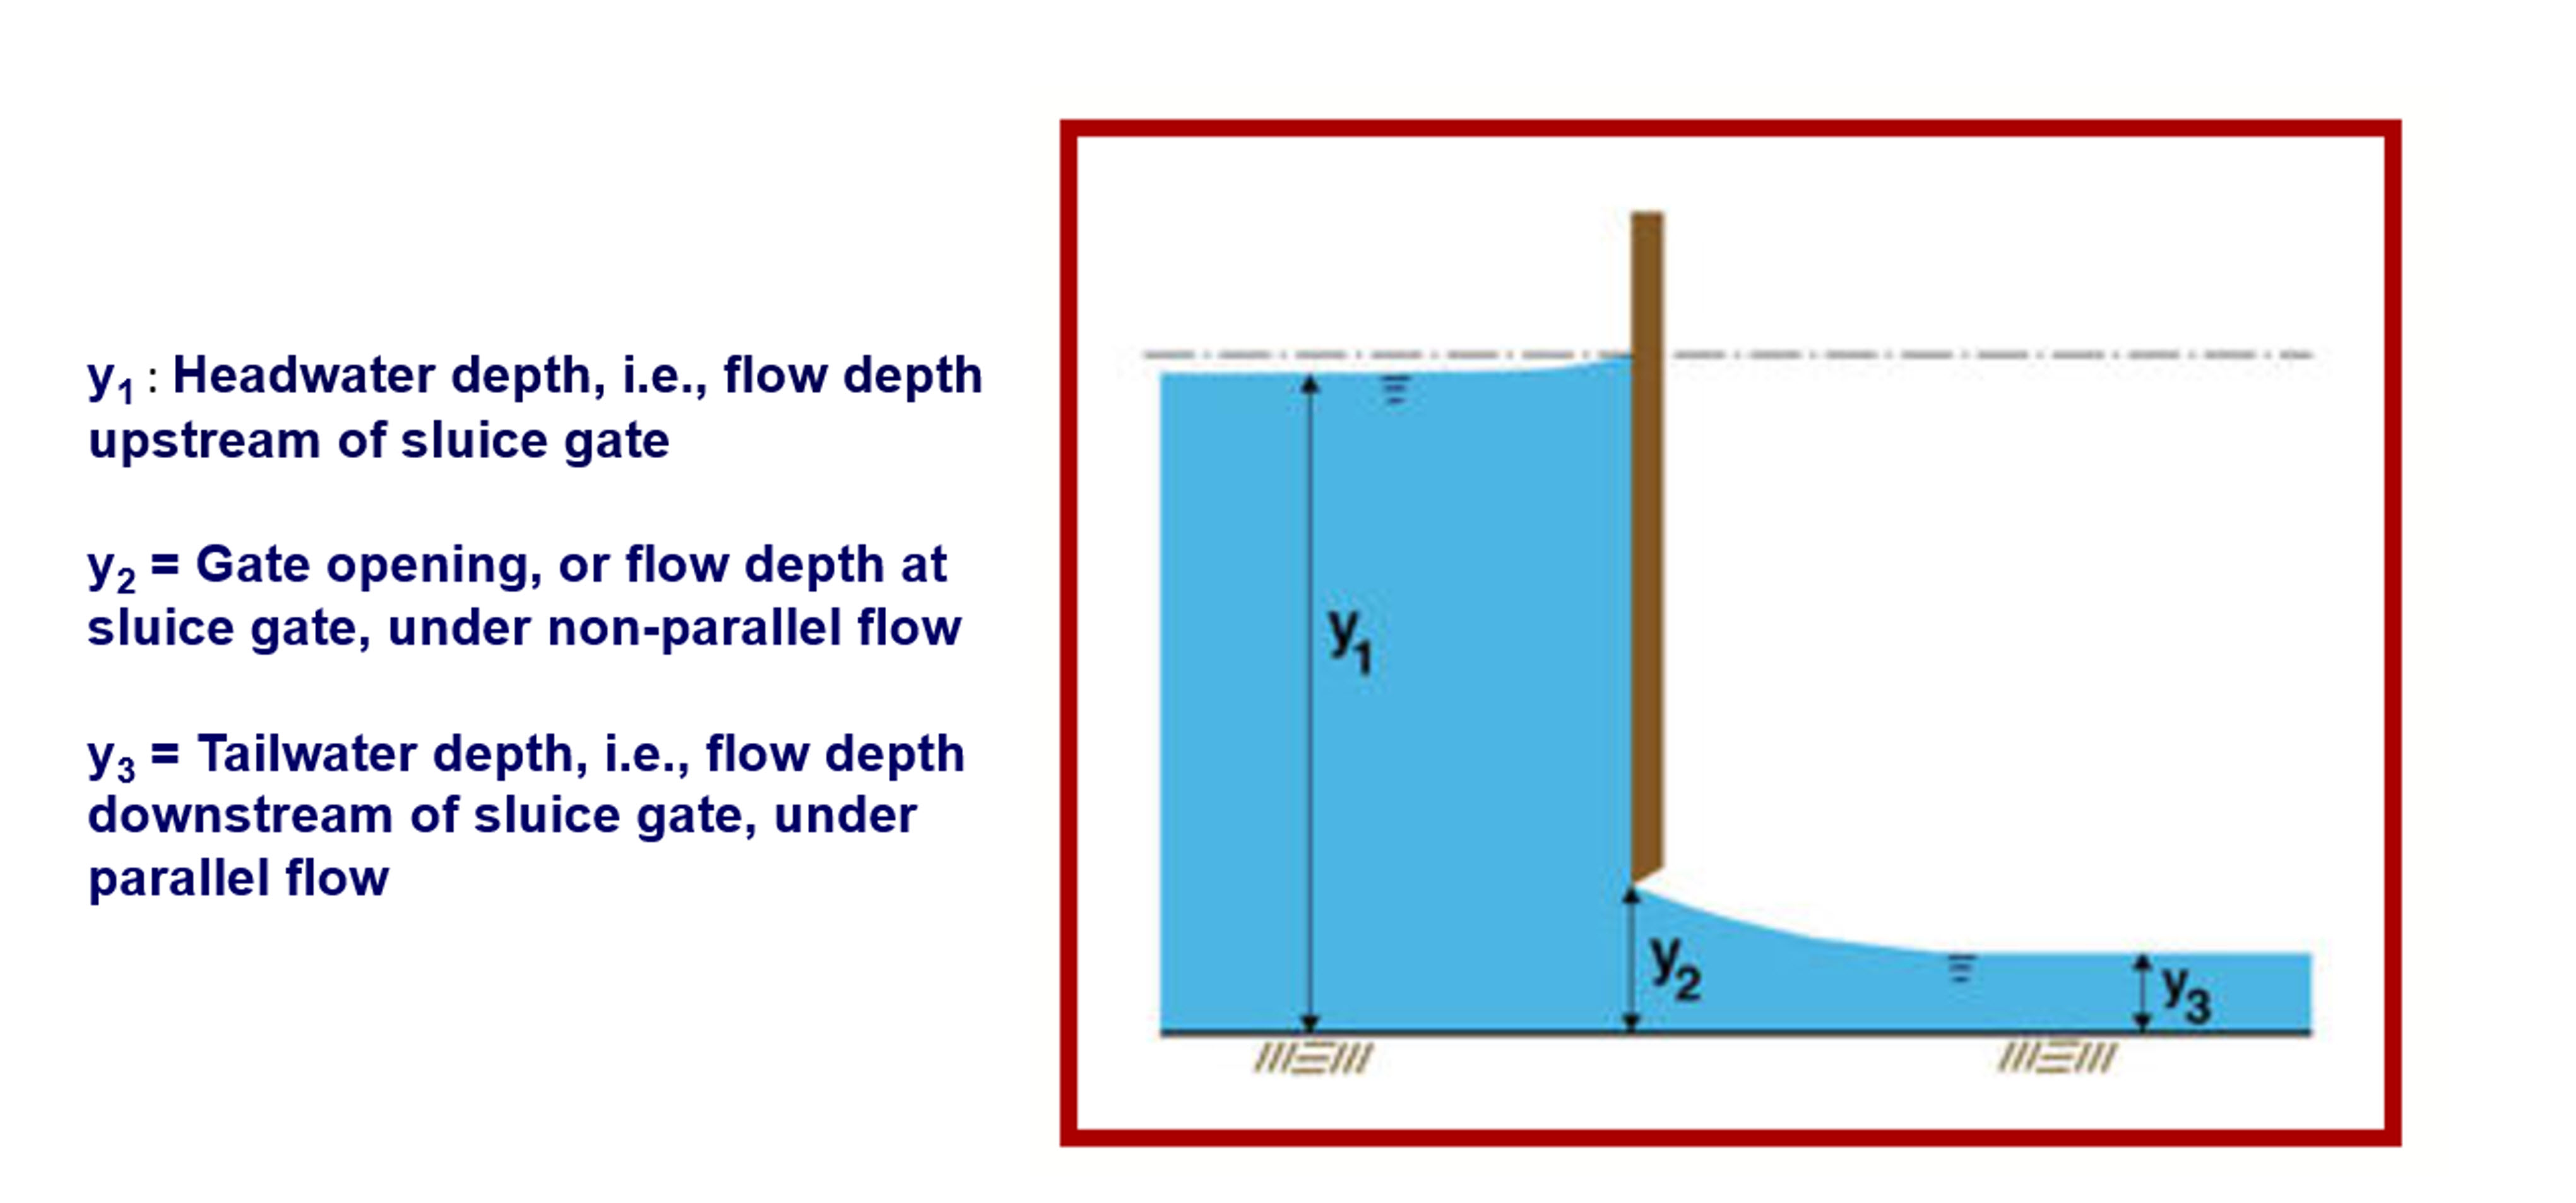
Regarding your question (I don’t understand what the sentence in the picture means“If the ratio of tailwater to headwater is less than 0.64, equation (2.81) for supercritical flow is applied. If the ratio of tailwater to headwater is greater than 0.68, equation (2.82) for subcritical flow is applied . ” supercritical flow and sub-critical weir flow equation should not be the equation (2.81) and equation (2.82)?Are the equations number written wrong?).
I apologize for any mistakes; it should be equations 2.82 and 2.83 as shown below:
If the ratio of tailwater to headwater is less than 0.64, equation (2.82) for supercritical flow is applied
If the ratio of tailwater to headwater is greater than 0.68, equation (2.83) for subcritical flow is applied
I am here to support you, and I need you to clarify some points below:
-
You mentioned that " I have tried to set it up many times,but not success." Do you mean that your model is not working, or is it not performing well when compared to the observed data?
-
If you are attempting to set up a sluice gate and want to compare the water elevation after the gate, please share the data with me via email at shanh@dsi.llc . This will help me better understand what you are trying to achieve.
Thank you very much.
As I mentioned earlier, The values of these coefficients can vary depending on various factors, including gate design, gate shape, water properties, and specific discharge conditions. There are no fixed or single-range values for these coefficients, and they can vary significantly in different situations.
The sub-critical discharge coefficient and super-critical discharge coefficient typically fall within the range of 0.6 to 1.2, but specific values may be higher or lower depending on flow conditions.
The free flow coefficient usually has a value close to 1.0.
The submerged discharge coefficient can also vary widely depending on gate design and water discharge conditions, typically ranging from 0.5 to 1.0.
To determine the precise values of these coefficients for a specific application, you should refer to design documents or seek specific guidance from the gate manufacturer. If you have data to validate your model, you could use a trial-and-error method to find the most suitable values for your case.
Thank you for your answer.
I sent a screenshot to the email you provided.
Please check and wait for a reply.
Thank you.
Thank you very much! I have tow question about it .In Figure 3 the “Rating Table/Flow Lookup Table” need to be choosed? and when set up the sluice gate it need to set up a MASK together?
Dear cuizhenyong2020,
I would like to address your questions as follows:
-
When setting up a sluice gate with a time series, in the “Rating Table/Flow Lookup Table” function - You only need to select the gate you want to set up.
-
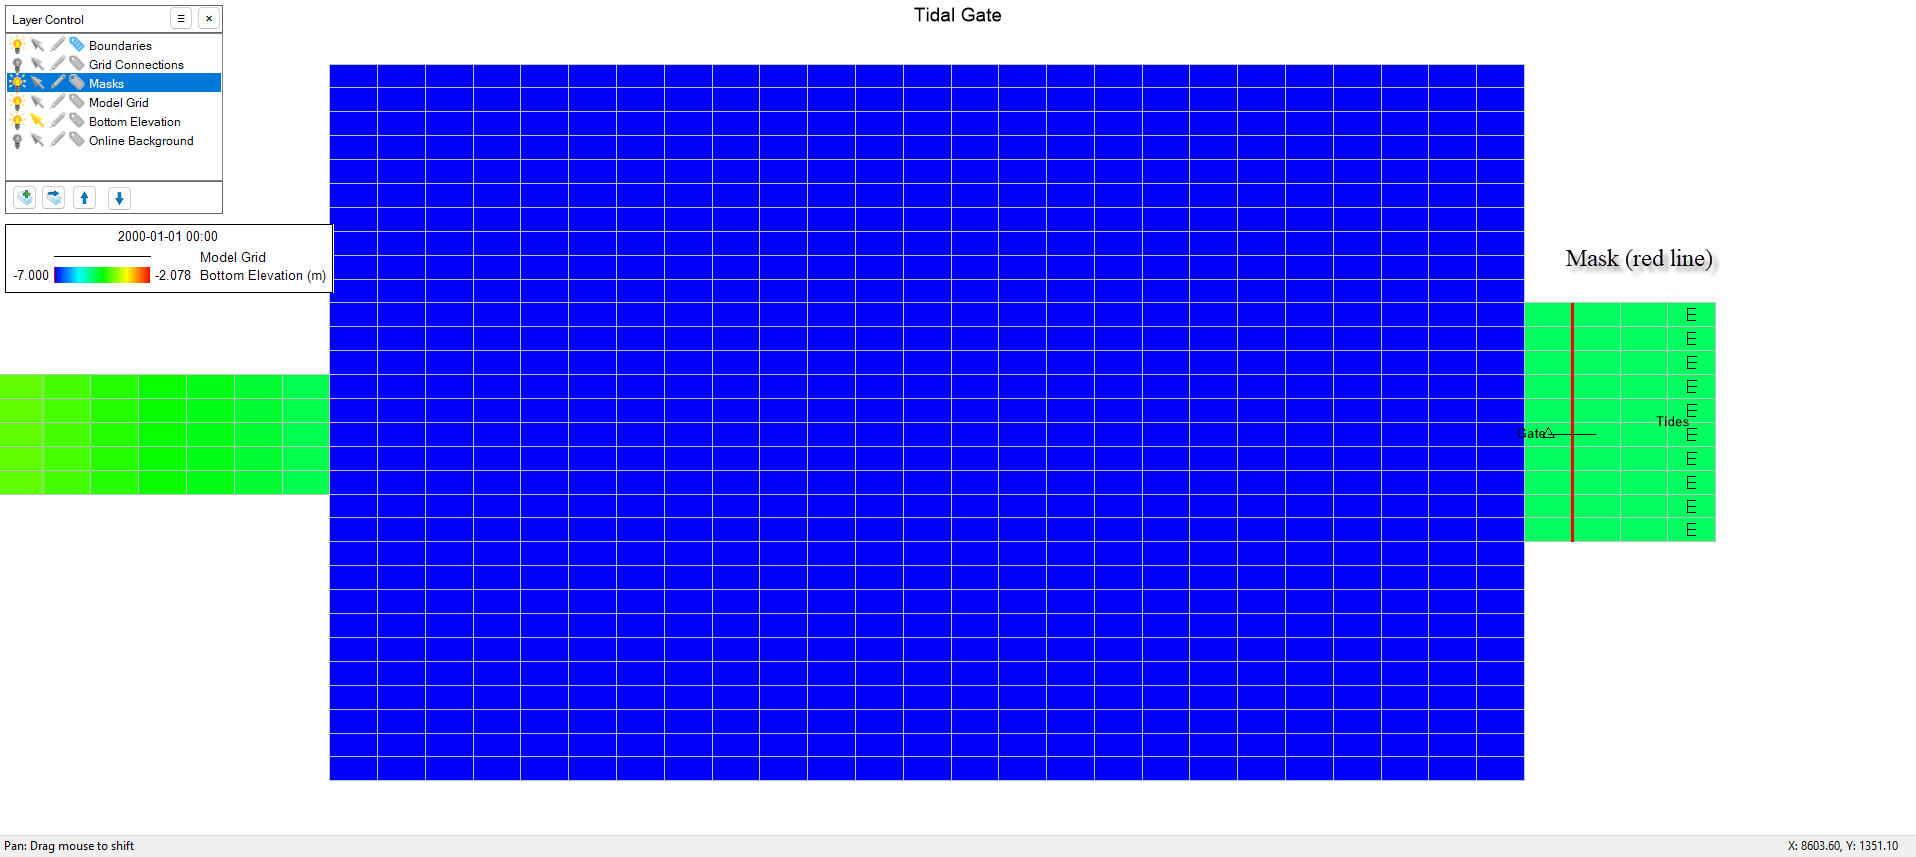
In response to your inquiry, “When setting up the sluice gate, does it need to be accompanied by setting up a MASK as well?” A model is typically configured to use grid masks to prevent flow except where the hydraulic structure is located. The structure allows flow across the mask, as shown in the figure below.
-
I have not received your email; please ensure that the email address is shanh@dsi.llc
Thank you very much.
Best regards,
Sai Hong Anh
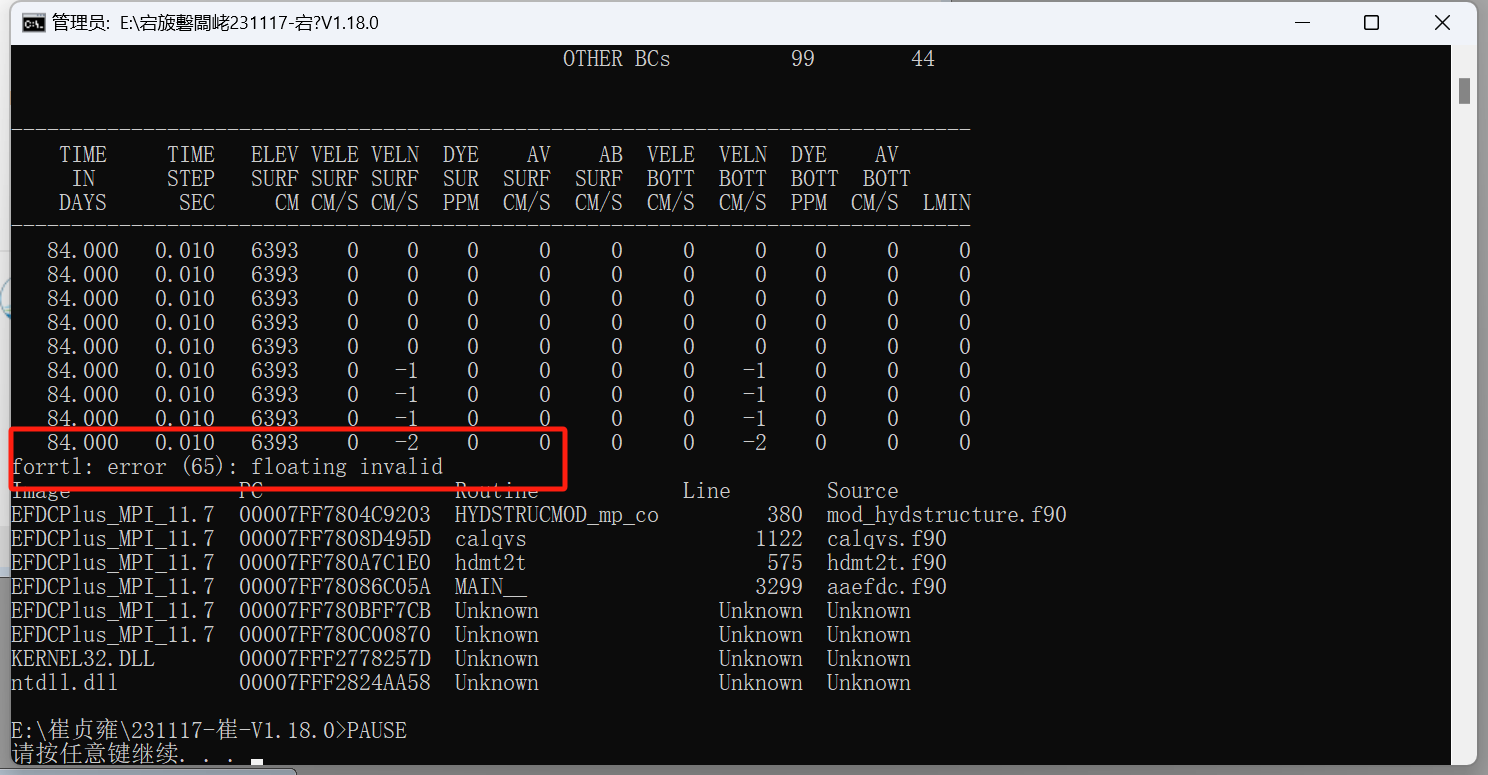
But when I don’t choose the “Rating Table/Flow Lookup Table” function." the model running error.So that’s why?
Dear Cuizhenyong2020,
I received your email. Could you please let me know which version of EFDC+ you are using, and is it licensed? If it is the free version, some functions may be limited.
Thank you,
I am using EE11.7.0 release230328 and it is licensed.
Thank you,
Hello, Cuizhenyong2020,
I apologize for misunderstanding your question. Regarding the “Rating Table/Flow Lookup Table” function, you only need to select the gate you want to set up.
Hello Cuizhenyong2020,
I am returning the model to you with some notifications below:
1.You need to set up the open boundary with an open face (South), as shown in Figure 1-2.
2.The input boundary conditions for the upstream should be inflow (discharge).
3.The input boundary conditions for the downstream should be water elevation (1st choice) or discharge (2nd choice).
4.I ran your model with the current setup (sent via email). I observed that the sluice gate in the setup is working well (figure 3). However, to compare with the observed data, you should calibrate it yourself.
Thank you very much,
Best regards,
Sai Hong Anh
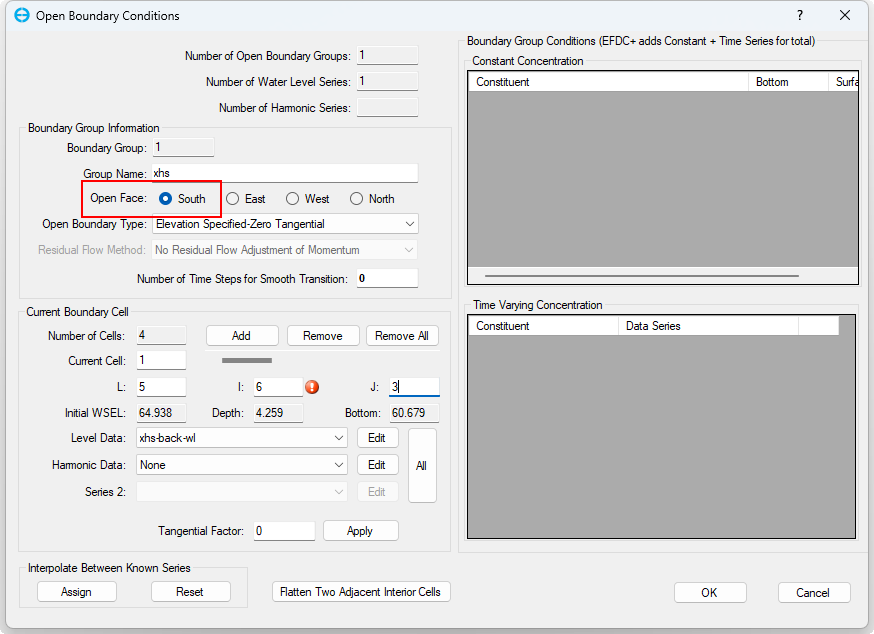
Figure 1
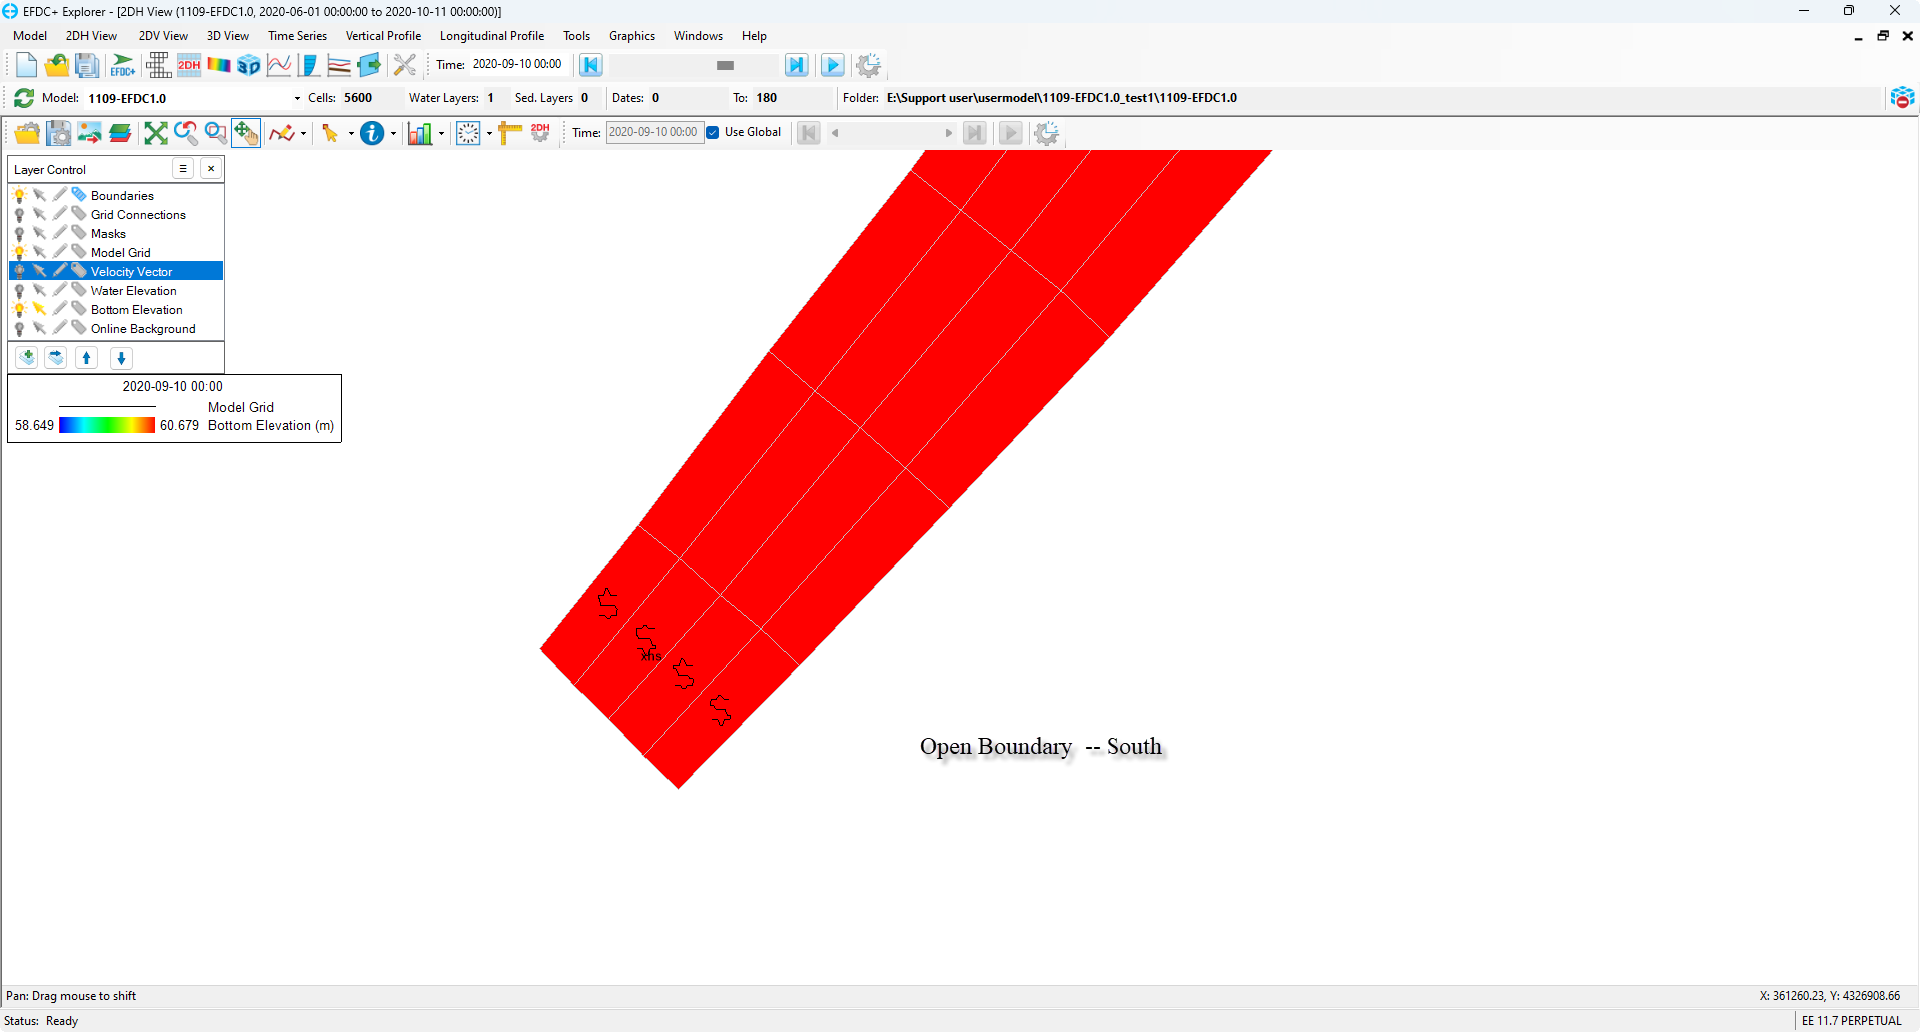
Figure 2
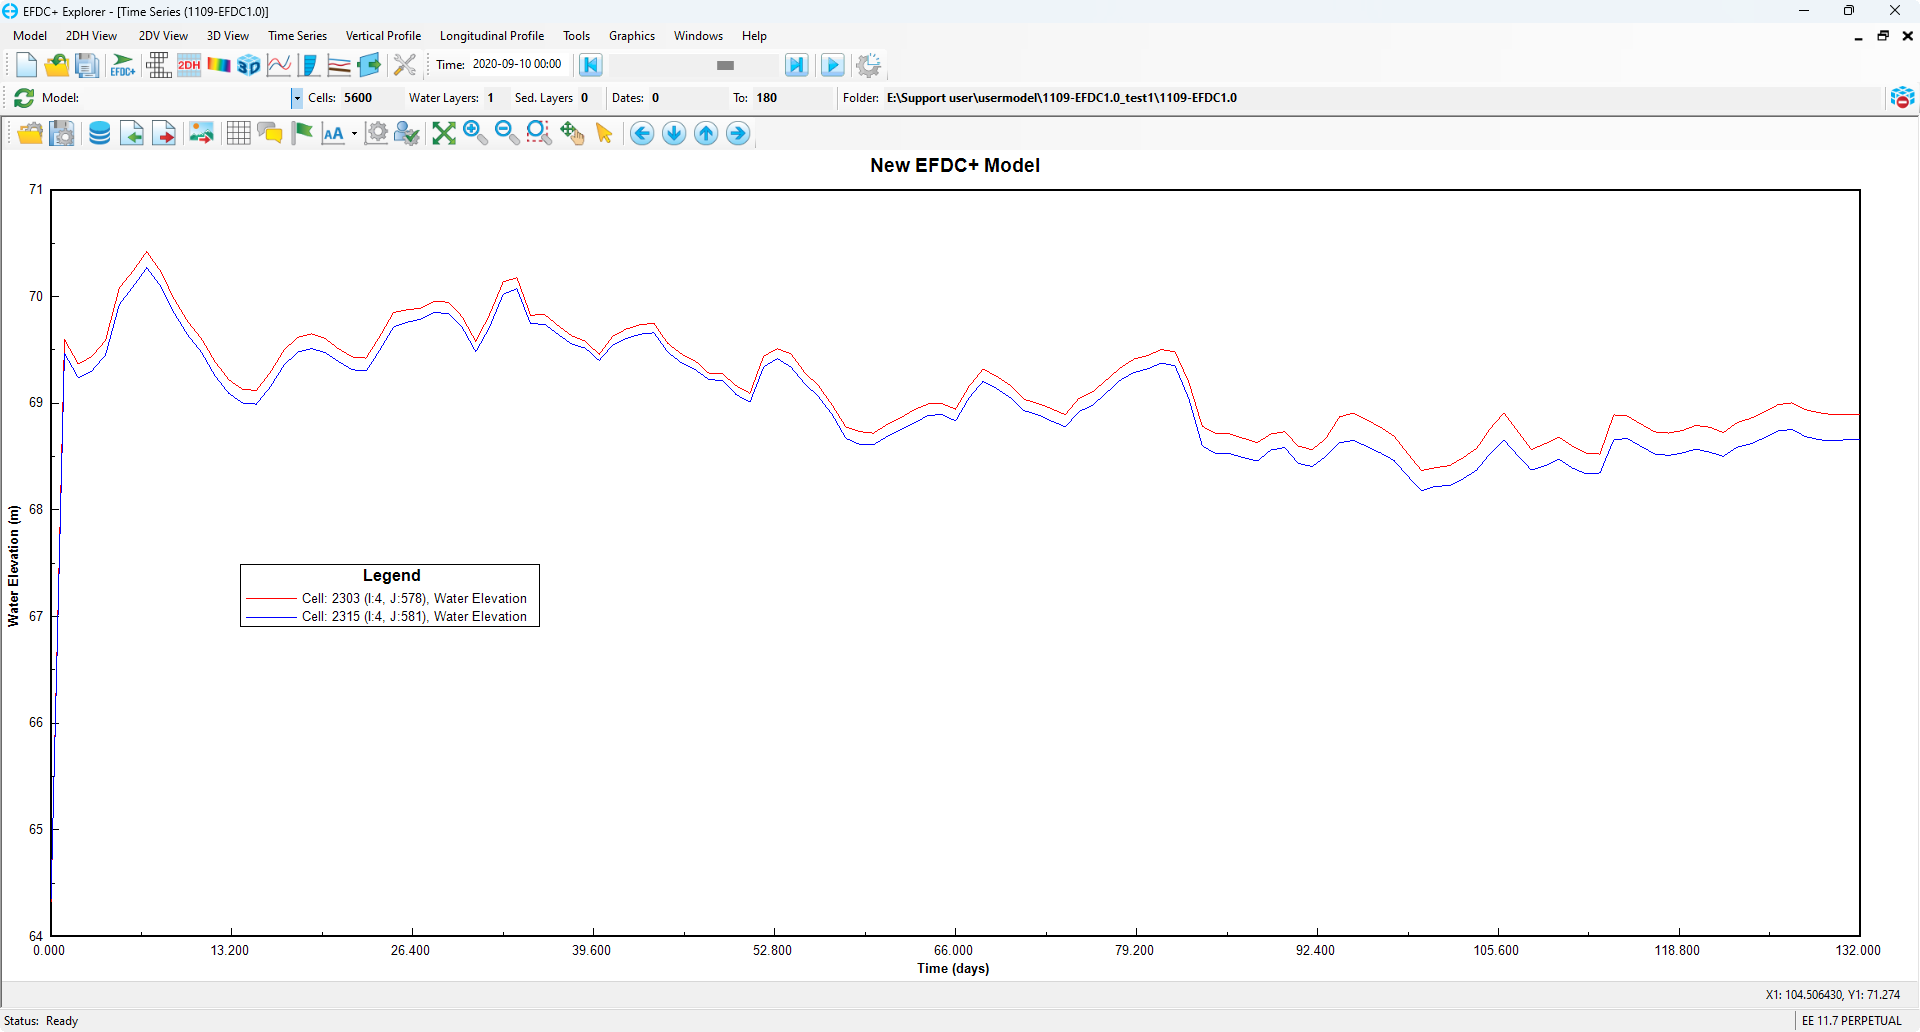
Figure 3. Elevation of water in front of and behind the gate
Thank you very much !